LeafletJS - 矢量图层( Vector Layers)
在上一章中,我们学习了如何在Leaflet中使用标记。 除了标记,我们还可以添加各种形状,如圆形,多边形,矩形,折线等。在本章中,我们将讨论如何使用Google地图提供的形状。
Polyline
要使用Leaflet JavaScript库在地图上绘制折线叠加层,请按照以下步骤操作 -
Step 1 - 通过传递“ div ”元素(字符串或对象)和映射选项(可选)来创建Map对象。
Step 2 - 通过传递所需图块的URL来创建Layer对象。
Step 3 - 使用Map类的addLayer()方法将图层对象添加到Map 。
Step 4 - 创建一个latlangs变量来保持绘制折线的点,如下所示。
// Creating latlng object
var latlngs = [
   [17.385044, 78.486671],
   [16.506174, 80.648015],
   [17.000538, 81.804034],
   [17.686816, 83.218482]
];
Step 5 - 使用L.polyline()创建折线。 要绘制折线,请将位置作为变量传递,并选择一个选项以指定线条的颜色。
// Creating a poly line
var polyline = L.polyline(latlngs, {color: 'red'});
Step 6 - 使用Polyline类的addTo()方法将Polyline添加到地图。
// Adding to poly line to map
polyline.addTo(map);
例子 (Example)
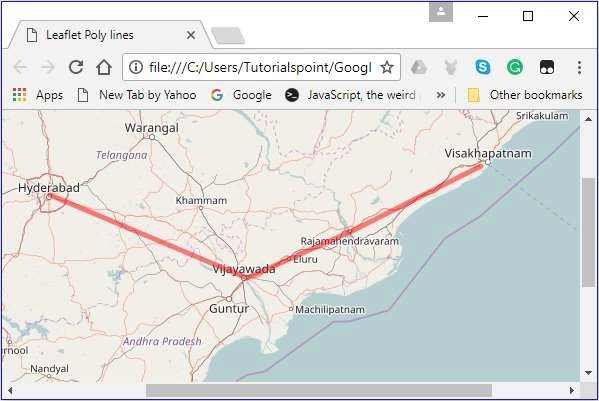
以下是绘制折线的代码,覆盖海德拉巴,Vijayawada,Rajamahendrawaram和Vishakhapatnam(印度)等城市。
DOCTYPE html>
<html>
   <head>
      <title>Leaflet Poly lines</title>
      <link rel = "stylesheet" href = "http://cdn.leafletjs.com/leaflet-0.7.3/leaflet.css"/>
      <script src = "http://cdn.leafletjs.com/leaflet-0.7.3/leaflet.js"></script>
   </head>
   <body>
      <div id = "map" style = "width:900px; height:580px"></div>
      <script>
         // Creating map options
         var mapOptions = {
            center: [16.506174, 80.648015],
            zoom: 7
         }
         // Creating a map object
         var map = new L.map('map', mapOptions);
         // Creating a Layer object
         var layer = new L.TileLayer('http://{s}.tile.openstreetmap.org/{z}/{x}/{y}.png');
         // Adding layer to the map
         map.addLayer(layer);
         // Creating latlng object
         var latlngs = [
            [17.385044, 78.486671],
            [16.506174, 80.648015],
            [17.000538, 81.804034],
            [17.686816, 83.218482]
         ];
         // Creating a poly line
         var polyline = L.polyline(latlngs, {color: 'red'});
         // Adding to poly line to map
         polyline.addTo(map);
      </script>
   </body>
</html>
它生成以下输出
Polygon
要使用Leaflet JavaScript库在地图上绘制多边形叠加层,请按照以下步骤操作 -
Step 1 - 通过传递“ div ”元素(字符串或对象)和映射选项(可选)来创建Map对象。
Step 2 - 通过传递所需图块的URL来创建Layer对象。
Step 3 - 使用Map类的addLayer()方法将图层对象添加到Map 。
Step 4 - 创建一个latlangs变量来保存绘制多边形的点。
// Creating latlng object
var latlngs = [
   [17.385044, 78.486671],
   [16.506174, 80.648015],
   [17.686816, 83.218482]
];
Step 5 - 使用L.polygon()创建多边形。 将位置/点作为变量传递以绘制多边形,并选择指定多边形的颜色。
// Creating a polygon
var polygon = L.polygon(latlngs, {color: 'red'});
Step 6 - 使用Polygon类的addTo()方法将Polygon添加到地图中。
// Adding to polygon to map
polygon.addTo(map);
例子 (Example)
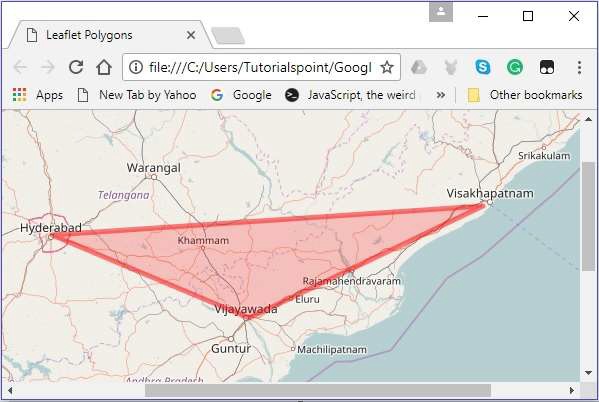
以下是绘制覆盖海德拉巴,维杰亚瓦达和维沙卡帕特南(印度)城市的多边形的代码。
<!DOCTYPE html>
<html>
   <head>
      <title>Leaflet Polygons</title>
      <link rel = "stylesheet" href = "http://cdn.leafletjs.com/leaflet-0.7.3/leaflet.css"/>
      <script src = "http://cdn.leafletjs.com/leaflet-0.7.3/leaflet.js"></script>
   </head>
   <body>
      <div id = "map" style = "width:900px; height:580px"></div>
      <script>
         // Creating map options
         var mapOptions = {
            center: [16.506174, 80.648015],
            zoom: 7
         }
         // Creating a map object
         var map = new L.map('map', mapOptions);
         // Creating a Layer object
         var layer = new L.TileLayer('http://{s}.tile.openstreetmap.org/{z}/{x}/{y}.png');
         // Adding layer to the map
         map.addLayer(layer);
         // Creating latlng object
         var latlngs = [
            [17.385044, 78.486671],
            [16.506174, 80.648015],
            [17.686816, 83.218482]
         ];
         // Creating a polygon
         var polygon = L.polygon(latlngs, {color: 'red'});
         // Adding to polygon to map
         polygon.addTo(map);
      </script>
   </body>
</html>
它生成以下输出 -
矩形(Rectangle)
要使用Leaflet JavaScript库在地图上绘制矩形叠加层,请按照以下步骤操作
Step 1 - 通过传递“ div ”元素(字符串或对象)和映射选项(可选)来创建Map对象。
Step 2 - 通过传递所需图块的URL来创建Layer对象。
Step 3 - 使用Map类的addLayer()方法将图层对象添加到Map 。
Step 4 - 创建一个latlangs变量来保存点以在地图上绘制一个矩形。
// Creating latlng object
var latlngs = [
   [17.342761, 78.552432],
   [16.396553, 80.727725]
];
Step 5 - 使用L.rectangle()函数创建一个矩形。 将位置/点作为变量传递以绘制矩形和rectangleOptions以指定rectangleOptions的颜色和重量。
// Creating rectOptions
var rectOptions = {color: 'Red', weight: 1}
// Creating a rectangle
var rectangle = L.rectangle(latlngs, rectOptions);
Step 6 - 使用Polygon类的addTo()方法将矩形添加到地图。
// Adding to rectangle to map
rectangle.addTo(map);
例子 (Example)
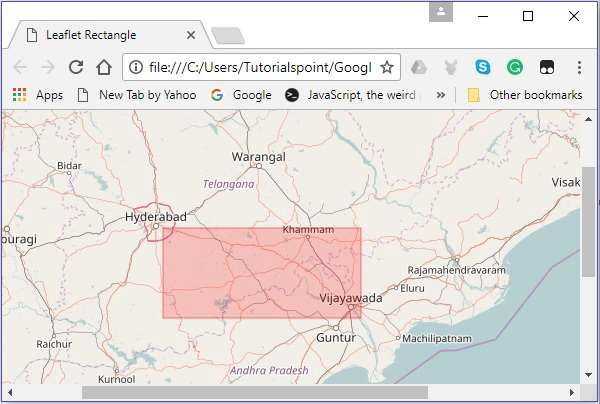
以下是使用Leaflet JavaScript库在地图上绘制矩形的代码。
<!DOCTYPE html>
<html>
   <head>
      <title>Leaflet Rectangle</title>
      <link rel = "stylesheet" href = "http://cdn.leafletjs.com/leaflet-0.7.3/leaflet.css"/>
      <script src = "http://cdn.leafletjs.com/leaflet-0.7.3/leaflet.js"></script>
   </head>
   <body>
      <div id = "map" style = "width:900px; height:580px"></div>
      <script>
         // Creating map options
         var mapOptions = {
            center: [16.506174, 80.648015],
            zoom: 7
         }
         var map = new L.map('map', mapOptions); // Creating a map object
         // Creating a Layer object
         var layer = new L.TileLayer('http://{s}.tile.openstreetmap.org/{z}/{x}/{y}.png');
         map.addLayer(layer); // Adding layer to the map
         // Creating latlng object
         var latlngs = [
            [17.342761, 78.552432],
            [16.396553, 80.727725]
         ];
         var rectOptions = {color: 'Red', weight: 1}   // Creating rectOptions
         // Creating a rectangle
         var rectangle = L.rectangle(latlngs, rectOptions);
         rectangle.addTo(map);   // Adding to rectangle to map
      </script>
   </body>
</html>
它生成以下输出 -
Circle
要使用Leaflet JavaScript库在地图上绘制圆形叠加层,请按照以下步骤操作。
Step 1 - 通过传递“ div ”元素(字符串或对象)和映射选项(可选)来创建Map对象。
Step 2 - 通过传递所需图块的URL来创建Layer对象。
Step 3 - 使用Map类的addLayer()方法将图层对象添加到Map 。
Step 4 - 创建一个latlangs变量来保持圆的中心,如下所示。
// Center of the circle
var circleCenter = [17.385044, 78.486671];
Step 5 - 创建变量circleOptions以指定options color,fillColor和fillOpacity的值,如下所示。
// Circle options
var circleOptions = {
   color: 'red',
   fillColor: '#f03',
   fillOpacity: 0
}
Step 6 - 使用L.circle()创建一个圆。 将圆心,半径和圆选项传递给此函数。
// Creating a circle
var circle = L.circle(circleCenter, 50000, circleOptions);
Step 7 - 使用Polyline类的addTo()方法将上面创建的圆添加到地图。
// Adding circle to the map
circle.addTo(map);
例子 (Example)
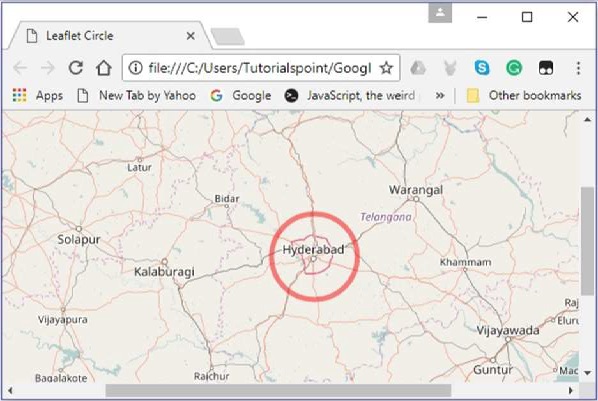
以下是用海德拉巴城市的坐标作为半径绘制圆形的代码。
<!DOCTYPE html>
<html>
   <head>
      <title>Leaflet Circle</title>
      <link rel = "stylesheet" href = "http://cdn.leafletjs.com/leaflet-0.7.3/leaflet.css"/>
      <script src = "http://cdn.leafletjs.com/leaflet-0.7.3/leaflet.js"></script>
   </head>
   <body>
      <div id = "map" style = "width: 900px; height: 580px"></div>
      <script>
         // Creating map options
         var mapOptions = {
            center: [17.385044, 78.486671],
            zoom: 7
         }
         var map = new L.map('map', mapOptions); // Creating a map object
         // Creating a Layer object
         var layer = new L.TileLayer('http://{s}.tile.openstreetmap.org/{z}/{x}/{y}.png');
         map.addLayer(layer);        // Adding layer to the map
         var circleCenter = [17.385044, 78.486671];     // Center of the circle
         // Circle options
         var circleOptions = {
            color: 'red',
            fillColor: '#f03',
            fillOpacity: 0
         }
         // Creating a circle
         var circle = L.circle(circleCenter, 50000, circleOptions);
         circle.addTo(map);     // Adding circle to the map
      </script>
   </body>
</html>>
它生成以下输出 -