Basic line
我们已经在Highcharts Configuration Syntax一章中看到了用于绘制此图表的配置 。 现在让我们考虑以下示例来进一步理解基本折线图。
例子 (Example)
HelloWorld.java
package com.iowiki.client;
import org.moxieapps.gwt.highcharts.client.Chart;
import org.moxieapps.gwt.highcharts.client.Legend;
import org.moxieapps.gwt.highcharts.client.Series.Type;
import org.moxieapps.gwt.highcharts.client.ToolTip;
import org.moxieapps.gwt.highcharts.client.XAxis;
import org.moxieapps.gwt.highcharts.client.YAxis;
import com.google.gwt.core.client.EntryPoint;
import com.google.gwt.user.client.ui.RootPanel;
public class HelloWorld implements EntryPoint {
public void onModuleLoad() {
Chart chart = new Chart()
.setType(Type.SPLINE)
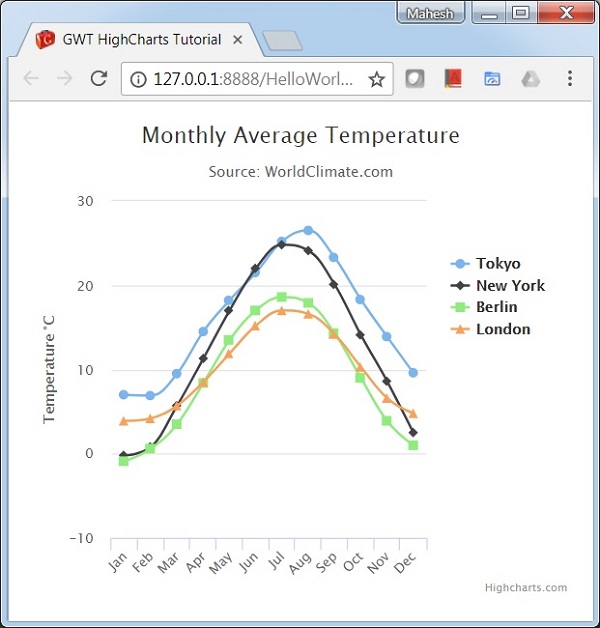
.setChartTitleText("Monthly Average Temperature")
.setChartSubtitleText("Source: WorldClimate.com");
XAxis xAxis = chart.getXAxis();
xAxis.setCategories("Jan", "Feb", "Mar", "Apr", "May", "Jun",
"Jul", "Aug", "Sep", "Oct", "Nov", "Dec");
YAxis yAxis = chart.getYAxis();
yAxis.setAxisTitleText("Temperature °C");
yAxis.createPlotLine()
.setValue(0)
.setWidth(1)
.setColor("#808080");
ToolTip toolTip = new ToolTip();
toolTip.setValueSuffix("°C");
chart.setToolTip(toolTip);
Legend legend = new Legend();
legend.setLayout(Legend.Layout.VERTICAL)
.setAlign(Legend.Align.RIGHT)
.setVerticalAlign(Legend.VerticalAlign.TOP)
.setX(-10)
.setY(100)
.setBorderWidth(0);
chart.setLegend(legend);
chart.addSeries(chart.createSeries()
.setName("Tokyo")
.setPoints(new Number[] {
7.0, 6.9, 9.5, 14.5, 18.2, 21.5, 25.2,
26.5, 23.3, 18.3, 13.9, 9.6
})
);
chart.addSeries(chart.createSeries()
.setName("New York")
.setPoints(new Number[] {
-0.2, 0.8, 5.7, 11.3, 17.0, 22.0, 24.8,
24.1, 20.1, 14.1, 8.6, 2.5
})
);
chart.addSeries(chart.createSeries()
.setName("Berlin")
.setPoints(new Number[] {
-0.9, 0.6, 3.5, 8.4, 13.5, 17.0, 18.6,
17.9, 14.3, 9.0, 3.9, 1.0
})
);
chart.addSeries(chart.createSeries()
.setName("London")
.setPoints(new Number[] {
3.9, 4.2, 5.7, 8.5, 11.9, 15.2, 17.0,
16.6, 14.2, 10.3, 6.6, 4.8
})
);
RootPanel.get().add(chart);
}
}
结果 (Result)
验证结果。