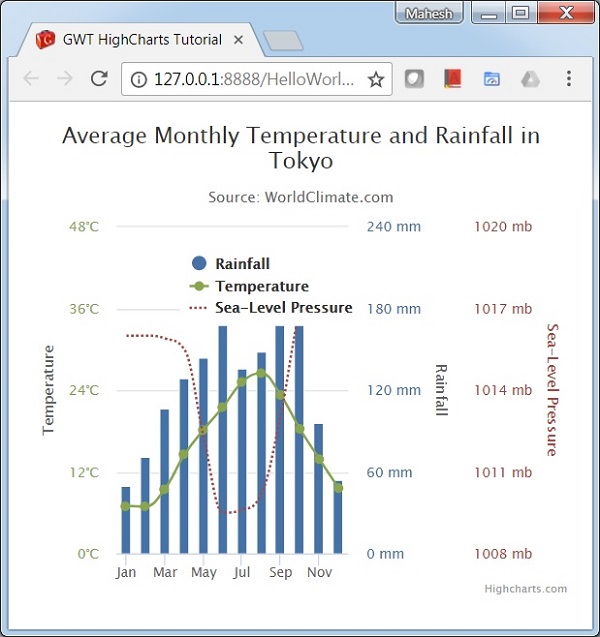
Multiple Axes
以下是具有多个轴的图表的示例。
我们已经在Highcharts Configuration Syntax一章中看到了用于绘制图表的配置 。
下面给出具有多个轴的组合图的示例。
配置 (Configurations)
现在让我们看一下所采取的其他配置/步骤。
YAxis
使用chart.getYAxis(index)方法获取多个yAxis。
chart.getYAxis(0);
chart.getYAxis(1);
例子 (Example)
HelloWorld.java
package com.iowiki.client;
import org.moxieapps.gwt.highcharts.client.AxisTitle;
import org.moxieapps.gwt.highcharts.client.Chart;
import org.moxieapps.gwt.highcharts.client.Legend;
import org.moxieapps.gwt.highcharts.client.PlotLine.DashStyle;
import org.moxieapps.gwt.highcharts.client.Series;
import org.moxieapps.gwt.highcharts.client.Style;
import org.moxieapps.gwt.highcharts.client.ToolTip;
import org.moxieapps.gwt.highcharts.client.ToolTipData;
import org.moxieapps.gwt.highcharts.client.ToolTipFormatter;
import org.moxieapps.gwt.highcharts.client.labels.AxisLabelsData;
import org.moxieapps.gwt.highcharts.client.labels.AxisLabelsFormatter;
import org.moxieapps.gwt.highcharts.client.labels.YAxisLabels;
import org.moxieapps.gwt.highcharts.client.plotOptions.ColumnPlotOptions;
import org.moxieapps.gwt.highcharts.client.plotOptions.Marker;
import org.moxieapps.gwt.highcharts.client.plotOptions.SplinePlotOptions;
import com.google.gwt.core.client.EntryPoint;
import com.google.gwt.user.client.ui.RootPanel;
public class HelloWorld implements EntryPoint {
   public void onModuleLoad() {
      final Chart chart = new Chart()
         .setChartTitleText("Average Monthly Temperature and Rainfall in Tokyo")
         .setChartSubtitleText("Source: WorldClimate.com")
         .setToolTip(new ToolTip()
            .setFormatter(new ToolTipFormatter() {
               @Override
               public String format(ToolTipData toolTipData) {
                  String unit = "mm";
                  if ("Temperature".equals(toolTipData.getSeriesName())) {
                     unit = "°C";
                  } else if ("Sea-Level Pressure".equals(toolTipData.getSeriesName())) {
                     unit = "mb";
                  }
                  return toolTipData.getXAsString() + ": " + toolTipData.getYAsDouble() + " " + unit;
               }
            })
         )
         .setLegend(new Legend()
            .setLayout(Legend.Layout.VERTICAL)
            .setAlign(Legend.Align.LEFT)
            .setVerticalAlign(Legend.VerticalAlign.TOP)
            .setX(120)
            .setY(100)
            .setFloating(true)
            .setBackgroundColor("#FFFFFF")
         );
         chart.getXAxis()
            .setCategories("Jan", "Feb", "Mar", "Apr", "May", "Jun",
            "Jul", "Aug", "Sep", "Oct", "Nov", "Dec"  );
         // Primary yAxis
         chart.getYAxis(0)
            .setAxisTitle(new AxisTitle()
               .setText("Temperature")
            )
         .setLabels(new YAxisLabels()
            .setStyle(new Style()
               .setColor("#89A54E")
            )
            .setFormatter(new AxisLabelsFormatter() {
               @Override
               public String format(AxisLabelsData axisLabelsData) {
                  return axisLabelsData.getValueAsLong() + "°C";
               }
            })
         );
         // Secondary yAxis
         chart.getYAxis(1)
            .setAxisTitle(new AxisTitle()
               .setText("Rainfall")
            )
            .setOpposite(true)
            .setLabels(new YAxisLabels()
               .setStyle(new Style()
                  .setColor("#4572A7")
               )
               .setFormatter(new AxisLabelsFormatter() {
                  @Override
                  public String format(AxisLabelsData axisLabelsData) {
                     return axisLabelsData.getValueAsLong() + " mm";
                  }
               })
            )
            .setGridLineWidth(1);
            // Tertiary yAxis
            chart.getYAxis(2)
               .setAxisTitle(new AxisTitle()
               .setText("Sea-Level Pressure")
               .setStyle(new Style()
                  .setColor("#AA4643")
               )
            )
            .setOpposite(true)
            .setLabels(new YAxisLabels()
               .setStyle(new Style()
                  .setColor("#AA4643")
               )
               .setFormatter(new AxisLabelsFormatter() {
                  @Override
                  public String format(AxisLabelsData axisLabelsData) {
                     return axisLabelsData.getValueAsLong() + " mb";
                  }
               })
            )
            .setGridLineWidth(0);
            chart.addSeries(chart.createSeries()
               .setName("Rainfall")
               .setType(Series.Type.COLUMN)
               .setPlotOptions(new ColumnPlotOptions()
                  .setColor("#4572A7")
               )
               .setYAxis(1)
               .setPoints(new Number[]{
                  49.9, 71.5, 106.4, 129.2, 144.0, 176.0, 135.6, 148.5, 216.4, 194.1, 95.6, 54.4
               })
            );
            chart.addSeries(chart.createSeries()
               .setName("Temperature")
               .setType(Series.Type.SPLINE)
               .setPlotOptions(new SplinePlotOptions()
                  .setColor("#89A54E")
               )
               .setPoints(new Number[]{
                  7.0, 6.9, 9.5, 14.5, 18.2, 21.5, 25.2, 26.5, 23.3, 18.3, 13.9, 9.6
               })
            );
            chart.addSeries(chart.createSeries()
               .setName("Sea-Level Pressure")
               .setType(Series.Type.SPLINE)
               .setPlotOptions(new SplinePlotOptions()
                  .setColor("#AA4643")
                  .setMarker(new Marker()
                     .setEnabled(false)
                  )
                  .setDashStyle(DashStyle.SHORT_DOT)
               )
               .setYAxis(2)
               .setPoints(new Number[]{
                  1016, 1016, 1015.9, 1015.5, 1012.3, 1009.5, 1009.6, 1010.2, 1013.1, 1016.9, 1018.2, 1016.7
               })
            );
         RootPanel.get().add(chart);
   }
}
结果 (Result)
验证结果。