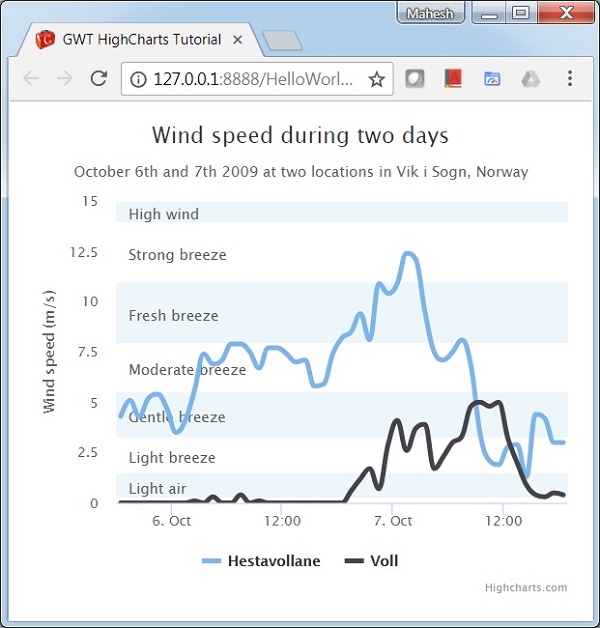
样条带的样条(Spline with plot bands)
以下是带有绘图带的样条图的示例。
我们已经在Highcharts Configuration Syntax一章中看到了用于绘制图表的配置 。 现在,让我们了解带有绘图带的样条图的示例,其中采用其他配置/步骤。
配置 (Configurations)
使用yAxis.plotBands属性配置波段。 使用'from'和'to'属性设置波段范围。 使用'color'属性设置band的颜色。 使用'label'属性设置band的标签样式。
yAxis
yAxis.setAxisTitleText("Wind speed (m/s)")
   .setMin(0)
   .setMinorGridLineWidth(0)
   .setGridLineWidth(0)
   .setAlternateGridColor(null)
   .setPlotBands(
      yAxis.createPlotBand()   // Light air
         .setFrom(0.3)
         .setTo(1.5)
         .setColor(blueColor)
         .setLabel(new PlotBandLabel()
            .setText("Light air")
            .setStyle(new Style()
               .setColor("#606060")
            )
         ),
      yAxis.createPlotBand()   // Light breeze
         .setFrom(1.5)
         .setTo(3.3)
         .setColor(clearColor)
         .setLabel(new PlotBandLabel()
            .setText("Light breeze")
            .setStyle(new Style()
               .setColor("#606060")
            )
         )
   );
例子 (Example)
HelloWorld.java
package com.iowiki.client;
import java.util.Date;
import org.moxieapps.gwt.highcharts.client.Chart;
import org.moxieapps.gwt.highcharts.client.Color;
import org.moxieapps.gwt.highcharts.client.Point;
import org.moxieapps.gwt.highcharts.client.Series.Type;
import org.moxieapps.gwt.highcharts.client.Style;
import org.moxieapps.gwt.highcharts.client.ToolTip;
import org.moxieapps.gwt.highcharts.client.ToolTipData;
import org.moxieapps.gwt.highcharts.client.ToolTipFormatter;
import org.moxieapps.gwt.highcharts.client.XAxis;
import org.moxieapps.gwt.highcharts.client.YAxis;
import org.moxieapps.gwt.highcharts.client.labels.AxisLabelsData;
import org.moxieapps.gwt.highcharts.client.labels.AxisLabelsFormatter;
import org.moxieapps.gwt.highcharts.client.labels.PlotBandLabel;
import org.moxieapps.gwt.highcharts.client.labels.YAxisLabels;
import org.moxieapps.gwt.highcharts.client.plotOptions.Marker;
import org.moxieapps.gwt.highcharts.client.plotOptions.SplinePlotOptions;
import org.moxieapps.gwt.highcharts.client.Axis;
import com.google.gwt.core.client.EntryPoint;
import com.google.gwt.i18n.client.DateTimeFormat;
import com.google.gwt.user.client.ui.RootPanel;
public class HelloWorld implements EntryPoint {
   public void onModuleLoad() {
      Chart chart = new Chart()
         .setType(Type.SPLINE)
         .setChartTitleText("Wind speed during two days")
         .setChartSubtitleText("October 6th and 7th 2009 at two locations in Vik i Sogn, Norway");
         XAxis xAxis = chart.getXAxis().setType(Axis.Type.DATE_TIME);
         YAxis yAxis = chart.getYAxis();
         final Color blueColor = new Color(68, 170, 213, 0.1);
         final Color clearColor = new Color(0, 0, 0, 0);
         yAxis.setAxisTitleText("Wind speed (m/s)")
            .setMin(0)
            .setMinorGridLineWidth(0)
            .setGridLineWidth(0)
            .setAlternateGridColor(null)
            .setPlotBands(
               yAxis.createPlotBand()   // Light air
                  .setFrom(0.3)
                  .setTo(1.5)
                  .setColor(blueColor)
                  .setLabel(new PlotBandLabel()
                     .setText("Light air")
                     .setStyle(new Style()
                        .setColor("#606060")
                     )
                  ),
               yAxis.createPlotBand()   // Light breeze
                  .setFrom(1.5)
                  .setTo(3.3)
                  .setColor(clearColor)
                  .setLabel(new PlotBandLabel()
                     .setText("Light breeze")
                     .setStyle(new Style()
                        .setColor("#606060")
                     )
                  ),
               yAxis.createPlotBand()   // Gentle breeze
                  .setFrom(3.3)
                  .setTo(5.5)
                  .setColor(blueColor)
                  .setLabel(new PlotBandLabel()
                     .setText("Gentle breeze")
                     .setStyle(new Style()
                        .setColor("#606060")
                     )
                  ),
               yAxis.createPlotBand()   // Moderate breeze
                  .setFrom(5.5)
                  .setTo(8)
                  .setColor(clearColor)
                  .setLabel(new PlotBandLabel()
                     .setText("Moderate breeze")
                     .setStyle(new Style()
                        .setColor("#606060")
                     )
                  ),
               yAxis.createPlotBand()   // Fresh breeze
                  .setFrom(8)
                  .setTo(11)
                  .setColor(blueColor)
                  .setLabel(new PlotBandLabel()
                     .setText("Fresh breeze")
                     .setStyle(new Style()
                        .setColor("#606060")
                     )
                  ),
               yAxis.createPlotBand()   // Strong breeze
                  .setFrom(11)
                  .setTo(14)
                  .setColor(clearColor)
                  .setLabel(new PlotBandLabel()
                     .setText("Strong breeze")
                     .setStyle(new Style()
                        .setColor("#606060")
                     )
                  ),
               yAxis.createPlotBand()   // High wind
                  .setFrom(14)
                  .setTo(15)
                  .setColor(blueColor)
                  .setLabel(new PlotBandLabel()
                     .setText("High wind")
                     .setStyle(new Style()
                        .setColor("#606060")
                     )
                  )
            );
         ToolTip toolTip = new ToolTip();
         toolTip.setFormatter(new ToolTipFormatter() {
            @Override
            public String format(ToolTipData toolTipData) {
               return DateTimeFormat.getFormat("d. MMMM YYYY HH:00").format(
                  new Date(toolTipData.getXAsLong())
                  ) + ": " + toolTipData.getYAsDouble() + " m/s";
            }
         });
         chart.setToolTip(toolTip);
         chart.setSplinePlotOptions(new SplinePlotOptions()
            .setLineWidth(4)
            .setHoverStateLineWidth(5)
            .setMarker(new Marker()
               .setEnabled(false)
               .setHoverState(new Marker()
                  .setEnabled(true)
                  .setSymbol(Marker.Symbol.CIRCLE)
                  .setRadius(5)
                  .setLineWidth(1)
               )
            )
            .setPointInterval(3600000)  // one hour
            .setPointStart(
               DateTimeFormat.getFormat("yyyy-MM-dd").parse("2009-10-06").getTime()
            )
         );
         chart.addSeries(chart.createSeries()
            .setName("Hestavollane")
            .setPoints(new Number[]{
               4.3, 5.1, 4.3, 5.2, 5.4, 4.7, 3.5, 4.1, 5.6, 7.4, 6.9, 7.1,
               7.9, 7.9, 7.5, 6.7, 7.7, 7.7, 7.4, 7.0, 7.1, 5.8, 5.9, 7.4,
               8.2, 8.5, 9.4, 8.1, 10.9, 10.4, 10.9, 12.4, 12.1, 9.5, 7.5,
               7.1, 7.5, 8.1, 6.8, 3.4, 2.1, 1.9, 2.8, 2.9, 1.3, 4.4, 4.2,
               3.0, 3.0
            })
         );
         chart.addSeries(chart.createSeries()
            .setName("Voll")
            .setPoints(new Number[] {
               0.0, 0.0, 0.0, 0.0, 0.0, 0.0, 0.0, 0.0, 0.1, 0.0, 0.3, 0.0,
               0.0, 0.4, 0.0, 0.1, 0.0, 0.0, 0.0, 0.0, 0.0, 0.0, 0.0, 0.0,
               0.0, 0.6, 1.2, 1.7, 0.7, 2.9, 4.1, 2.6, 3.7, 3.9, 1.7, 2.3,
               3.0, 3.3, 4.8, 5.0, 4.8, 5.0, 3.2, 2.0, 0.9, 0.4, 0.3, 0.5, 0.4
            })
         );
      RootPanel.get().add(chart);
   }
}
结果 (Result)
验证结果。