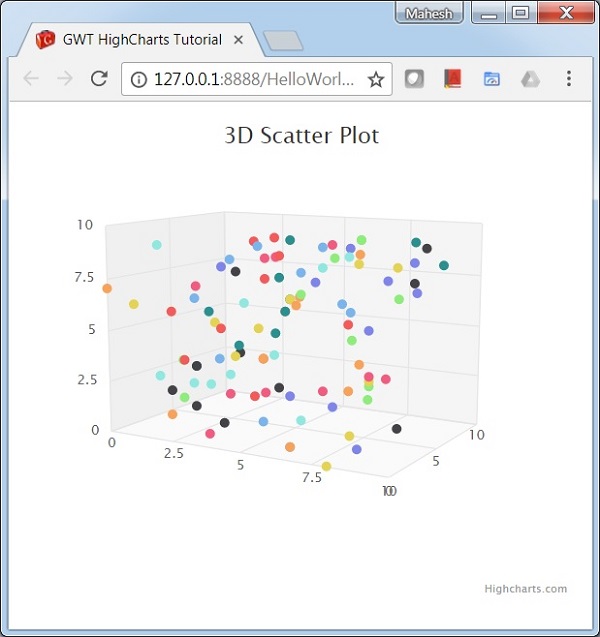
3D Scatter
以下是3D散点图的示例。
我们已经在Highcharts Configuration Syntax一章中看到了用于绘制图表的配置 。
下面给出了3D散点图的示例。
配置 (Configurations)
现在让我们看一下所采取的其他配置/步骤。
option3D
将散点图类型配置为基于3D。 Options3D设置启用的3D选项。
chart.setOptions3D(new Options3D()
   .setEnabled(true)
   .setAlpha(10)
   .setBeta(30)
   .setDepth(250)
   .setViewDistance(5)
   .setFrame(new Frame()
      .setBottom(new FramePanel()
         .setSize(1)
         .setColor(new Color(0, 0, 0, 0.02))
      )
      .setBack(new FramePanel ()
         .setSize(1)
         .setColor(new Color(0, 0, 0, 0.04))
      )
      .setSide(new FramePanel()
         .setSize(1)
         .setColor(new Color(0, 0, 0, 0.06))
      )
   )
)
例子 (Example)
HelloWorld.java
package com.iowiki.client;
import org.moxieapps.gwt.highcharts.client.Chart;
import org.moxieapps.gwt.highcharts.client.Color;
import org.moxieapps.gwt.highcharts.client.Frame;
import org.moxieapps.gwt.highcharts.client.Frame.FramePanel;
import org.moxieapps.gwt.highcharts.client.Legend;
import org.moxieapps.gwt.highcharts.client.Options3D;
import org.moxieapps.gwt.highcharts.client.Series;
import com.google.gwt.core.client.EntryPoint;
import com.google.gwt.user.client.ui.RootPanel;
public class HelloWorld implements EntryPoint {
   public void onModuleLoad() {
      final Chart chart = new Chart()
         .setMarginBottom(100)
         .setMarginRight(50)
         .setType(Series.Type.SCATTER)
         .setOptions3D(new Options3D()
            .setEnabled(true)
            .setAlpha(10)
            .setBeta(30)
            .setDepth(250)
            .setViewDistance(5)
            .setFrame(new Frame()
               .setBottom(new FramePanel()
                  .setSize(1)
                  .setColor(new Color(0, 0, 0, 0.02))
               )
               .setBack(new FramePanel ()
                  .setSize(1)
                  .setColor(new Color(0, 0, 0, 0.04))
               )
               .setSide(new FramePanel()
                  .setSize(1)
                  .setColor(new Color(0, 0, 0, 0.06))
               )
            )
         )
         .setChartTitleText("3D Scatter Plot");
      chart.getYAxis()
         .setMin(0)
         .setMax(10)
         .setAxisTitle(null);
      chart.getXAxis()
         .setMin(0)
         .setMax(10)
         .setGridLineWidth(1);
      chart.getZAxis()
         .setMin(0)
         .setMax(10);
      chart.setLegend(new Legend()
         .setEnabled(false)
      );
      chart.addSeries(chart.createSeries()
         .setName("Reading")
         .setColorByPoint(true)
         .setPoints(new Number[][] {
            {1, 6, 5}, {8, 7, 9}, {1, 3, 4}, {4, 6, 8}, {5, 7, 7}, {6, 9, 6},
            {7, 0, 5}, {2, 3, 3}, {3, 9, 8}, {3, 6, 5}, {4, 9, 4}, {2, 3, 3},
            {6, 9, 9}, {0, 7, 0}, {7, 7, 9}, {7, 2, 9}, {0, 6, 2}, {4, 6, 7},
            {3, 7, 7}, {0, 1, 7}, {2, 8, 6}, {2, 3, 7}, {6, 4, 8}, {3, 5, 9},
            {7, 9, 5}, {3, 1, 7}, {4, 4, 2}, {3, 6, 2}, {3, 1, 6}, {6, 8, 5},
            {6, 6, 7}, {4, 1, 1}, {7, 2, 7}, {7, 7, 0}, {8, 8, 9}, {9, 4, 1},
            {8, 3, 4}, {9, 8, 9}, {3, 5, 3}, {0, 2, 4}, {6, 0, 2}, {2, 1, 3},
            {5, 8, 9}, {2, 1, 1}, {9, 7, 6}, {3, 0, 2}, {9, 9, 0}, {3, 4, 8},
            {2, 6, 1}, {8, 9, 2}, {7, 6, 5}, {6, 3, 1}, {9, 3, 1}, {8, 9, 3},
            {9, 1, 0}, {3, 8, 7}, {8, 0, 0}, {4, 9, 7}, {8, 6, 2}, {4, 3, 0},
            {2, 3, 5}, {9, 1, 4}, {1, 1, 4}, {6, 0, 2}, {6, 1, 6}, {3, 8, 8},
            {8, 8, 7}, {5, 5, 0}, {3, 9, 6}, {5, 4, 3}, {6, 8, 3}, {0, 1, 5},
            {6, 7, 3}, {8, 3, 2}, {3, 8, 3}, {2, 1, 6}, {4, 6, 7}, {8, 9, 9},
            {5, 4, 2}, {6, 1, 3}, {6, 9, 5}, {4, 8, 2}, {9, 7, 4}, {5, 4, 2},
            {9, 6, 1}, {2, 7, 3}, {4, 5, 4}, {6, 8, 1}, {3, 4, 0}, {2, 2, 6},
            {5, 1, 2}, {9, 9, 7}, {6, 9, 9}, {8, 4, 3}, {4, 1, 7}, {6, 2, 5},
            {0, 4, 9}, {3, 5, 9}, {6, 9, 1}, {1, 9, 2}
         })
      );
      RootPanel.get().add(chart);
   }
}
结果 (Result)
验证结果。