DC.js - 复合图表( Composite Chart)
复合图表是DC.js提供的一种特殊类型的图表。 它提供了在同一坐标网格中渲染多个图表的选项。 复合图表使用最少的代码行启用高级图表可视化选项。
复合图表方法
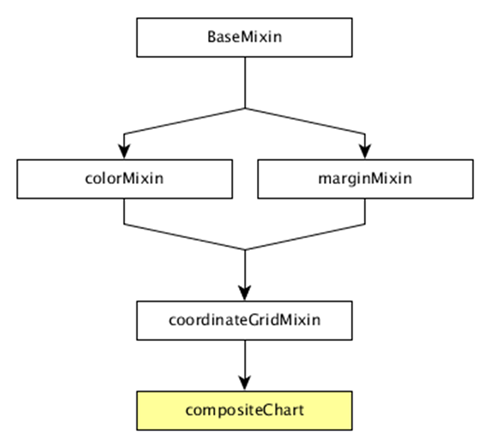
在继续绘制复合图表之前,我们需要了解dc.compositeChart类及其方法。 dc.compositeChart使用mixins来获取绘制图表的基本功能。 dc.compositeChart使用的mixins如下 -
- dc.baseMixin
- dc.marginMixin
- dc.colorMixin
- dc.coordinateGridMixin
dc.barChart的完整类图如下 -
dc.compositeChart获取上述mixin的所有方法。 它有自己的方法来绘制复合图表,如下所述 -
compose( [subChartArray])
设置要在同一坐标网格图中呈现的图表集合。
chart.compose([
   dc.lineChart(chart)
   dc.barChart(chart)
]);
children()
获取在同一坐标网格中组成的所有图表。
childOptions( [childOptions])
获取或设置在同一坐标网格中组成的所有子图表的图表选项。
shareTitle( [shareTitle])
获取或设置图表的共享标题。 如果设置,它将与在同一坐标网格中组成的所有子图表共享。
shareColors( [shareColors])
与shareTitle()函数类似,除了它共享颜色而不是标题。
rightY( [yScale])
获取或设置复合图表右轴的y标度。
rightYAxis( [rightYAxis])
获取或设置复合图表的右侧y轴。
rightYAxisLabel( rightYAxisLabel[??])
获取或设置正确的y轴标签。
alignYAxes( [alignYAxes])
获取或设置左右y轴之间的对齐方式。
useRightAxisGridLines( [useRightAxisGridLines])
获取或设置是否从复合图表的右y轴绘制网格线。 默认行为是从左侧y轴绘制。
绘制复合图表
让我们使用DC.js绘制一个复合图表。 为此,我们应该按照下面给出的步骤 -
第1步:定义变量
让我们定义一个图表变量,如下所示 -
var chart = dc.compositeChart('#compoiste');
这里,dc.compositeChart函数与一个具有composite作为其id的容器映射。
第2步:读取数据
从people.csv文件中读取数据 -
d3.csv("data/people.csv", function(errors, people) {
}
如果数据不存在,则返回错误。 我们将使用相同的people.csv文件。 样本数据文件如下 -
id,name,gender,DOB,MaritalStatus,CreditCardType
1,Damaris,Female,1973-02-18,false,visa-electron
2,Barbe,Female,1969-04-10,true,americanexpress
3,Belia,Female,1960-04-16,false,maestro
4,Leoline,Female,1995-01-19,true,bankcard
5,Valentine,Female,1992-04-16,false,
6,Rosanne,Female,1985-01-05,true,bankcard
7,Shalna,Female,1956-11-01,false,jcb
8,Mordy,Male,1990-03-27,true,china-unionpay
.............
.............
..............
第3步:映射数据
现在,映射数据如下所示 -
var ndx = crossfilter();
ndx.add(people.map(function(data) {
   return {
      age: ~~((Date.now() - new Date(data.DOB))/(31557600000)),
      male: data.gender == 'Male' ? 1 : 0,
      female: data.gender == 'Male' ? 0 : 1
   };
}));
在这里,我们从Crossfilter数据中分配了年龄。 ~~是一个双非按位运算符。 它被用作更快的替代品。
现在,应用维度年龄并使用下面给出的编码对性别数据进行分组 -
var dim  = ndx.dimension(dc.pluck('age')),
grp1 = dim.group().reduceSum(dc.pluck('male')),
grp2 = dim.group().reduceSum(dc.pluck('female'));
第4步:生成图表
现在,使用下面给出的编码生成复合图表 -
composite
   .width(768)
   .height(480)
   .x(d3.scale.linear().domain([15,70]))
   .yAxisLabel("Count")
   .xAxisLabel("Age")
   .legend(dc.legend().x(80).y(20).itemHeight(13).gap(5))
   .renderHorizontalGridLines(true)
   .compose ([
      dc.lineChart(composite)
         .dimension(dim)
         .colors('red')
         .group(grp1, "Male")
         .dashStyle([2,2]),
      dc.lineChart(composite)
         .dimension(dim)
         .colors('blue')
         .group(grp2, "Female")
         .dashStyle([5,5])
   ])
.brushOn(false)
.render();
这里,
图表宽度为768,高度为480。
d3.scale.linear函数用于构造具有指定域范围的新线性标度[15,70]。
我们将x轴标签指定为年龄,将y轴标签指定为计数。
接下来,将水平网格线渲染为true。
撰写折线图颜色值 - 红色表示男性,蓝色表示女性。
最后,我们将brushOn值设置为false并渲染图表。
第5步:工作示例
完整的代码如下。 创建一个网页composite.html并添加以下更改。
<html>
   <head>
      <title>DC composite chart Sample</title>
      <link rel = "stylesheet" type = "text/css" href = "css/bootstrap.css">
      <link rel = "stylesheet" type = "text/css" href = "css/dc.css"/>
      <script src = "js/d3.js"></script>
      <script src = "js/crossfilter.js"></script>
      <script src = "js/dc.js"></script>
   </head>
   <body>
      <div>
         <div id = "composite"></div>
      </div>
      <script type = "text/javascript">
         var composite = dc.compositeChart("#composite");
         d3.csv("data/people.csv", function(errors, people) {
            var ndx = crossfilter();
            ndx.add(people.map(function(data) {
               return {
                  age: ~~((Date.now() - new Date(data.DOB))/(31557600000)),
                  male: data.gender == 'Male' ? 1 : 0,
                  female: data.gender == 'Male' ? 0 : 1
               };
            }));
            var dim  = ndx.dimension(dc.pluck('age')),
            grp1 = dim.group().reduceSum(dc.pluck('male')),
            grp2 = dim.group().reduceSum(dc.pluck('female'));
            composite
               .width(768)
               .height(480)
               .x(d3.scale.linear().domain([15,70]))
               .yAxisLabel("Count")
               .xAxisLabel("Age")
               .legend(dc.legend().x(80).y(20).itemHeight(13).gap(5))
               .renderHorizontalGridLines(true)
               .compose ([
                  dc.lineChart(composite)
                  .dimension(dim)
                  .colors('red')
                  .group(grp1, "Male")
                  .dashStyle([2,2]),
                  dc.lineChart(composite)
                     .dimension(dim)
                     .colors('blue')
                     .group(grp2, "Female")
                     .dashStyle([5,5])
               ])
               .brushOn(false)
               .render();
         });
      </script>
   </body>
</html>
现在,请求浏览器,我们将看到以下响应。
新页面打开