D3.js - Working Example
让我们在本章中执行动画条形图。 对于此示例,我们将人口记录的前一章中使用的data.csv文件作为数据集并生成动画条形图。
为此,我们需要执行以下步骤 -
Step 1 - Apply styles - 使用下面给出的编码应用CSS样式。
<style>
   .bar {
      fill: green;
   }
   .highlight {
      fill: red;
   }
   .title {
      fill: blue;
      font-weight: bold;
   }
</style>
Step 2 - Define variables - 让我们使用下面的脚本定义SVG属性。
<script>
   var svg = d3.select("svg"), margin = 200,
   width = svg.attr("width") - margin,
   height = svg.attr("height") - margin;
</script>
Step 3 - Append text - 现在,附加文本并使用下面的编码应用转换。
svg.append("text")
   .attr("transform", "translate(100,0)")
   .attr("x", 50)
   .attr("y", 50)
   .attr("font-size", "20px")
   .attr("class", "title")
   .text("Population bar chart")
Step 4 - Create scale range - 在此步骤中,我们可以创建比例范围并附加组元素。 它定义如下。
var x = d3.scaleBand().range([0, width]).padding(0.4),
   y = d3.scaleLinear()
      .range([height, 0]);
   var g = svg.append("g")
      .attr("transform", "translate(" + 100 + "," + 100 + ")");
Step 5 - Read data - 我们已在前面的示例中创建了data.csv文件。 我们在这里使用过相同的文件。
year,population
2006,40
2008,45
2010,48
2012,51
2014,53
2016,57
2017,62
现在,使用下面的代码阅读上述文件。
d3.csv("data.csv", function(error, data) {
   if (error) {
      throw error;
   }
Step 6 - Set domain - 现在,使用下面的编码设置域。
x.domain(data.map(function(d) { return d.year; }));
y.domain([0, d3.max(data, function(d) { return d.population; })]);
Step 7 - Add X-axis - 现在,您可以将X轴添加到转换中。 如下所示。
g.append("g")
   .attr("transform", "translate(0," + height + ")")
   .call(d3.axisBottom(x)).append("text")
   .attr("y", height - 250).attr("x", width - 100)
   .attr("text-anchor", "end").attr("font-size", "18px")
   .attr("stroke", "blue").text("year");
Step 8 - Add Y-axis - 使用下面给出的代码Add Y-axis添加到变换中。
g.append("g")
   .append("text").attr("transform", "rotate(-90)")
   .attr("y", 6).attr("dy", "-5.1em")
   .attr("text-anchor", "end").attr("font-size", "18px")
   .attr("stroke", "blue").text("population");
Step 9 - Append group elements - 现在,追加组元素并将变换应用于Y轴,如下所述。
g.append("g")
   .attr("transform", "translate(0, 0)")
   .call(d3.axisLeft(y))
Step 10 - Select the bar class - 现在,选择Select the bar class所有元素,如下所述。
g.selectAll(".bar")
   .data(data).enter()
   .append("rect")
   .attr("class", "bar")
   .on("mouseover", onMouseOver)
   .on("mouseout", onMouseOut)
   .attr("x", function(d) { return x(d.year); })
   .attr("y", function(d) { return y(d.population); })
   .attr("width", x.bandwidth())
   .transition()
   .ease(d3.easeLinear)
   .duration(200)
   .delay(function (d, i) {
      return i * 25;
   })
   .attr("height", function(d) { return height - y(d.population); });
});
在这里,我们为mouseout和mouseover添加了listener事件以执行动画。 当鼠标悬停在特定条上并离开时,它会应用动画。 这些功能将在以下步骤中说明。
.ease(d3.easeLinear)函数用于在动画中执行明显的运动。 它以200的持续时间处理慢进和慢进运动。可以使用以下方法计算延迟:
.delay(function (d, i) {
   return i * 25;
})
Step 11 - Mouseover event handler function - 让我们创建一个鼠标悬停事件处理程序来处理鼠标事件,如下所示。
function onMouseOver(d, i) {
   d3.select(this)
      .attr('class', 'highlight');
   d3.select(this)
      .transition()
      .duration(200)
      .attr('width', x.bandwidth() + 5)
      .attr("y", function(d) { return y(d.population) - 10; })
      .attr("height", function(d) { return height - y(d.population) + 10; });
   g.append("text")
      .attr('class', 'val')
   .attr('x', function() {
      return x(d.year);
   })
   .attr('y', function() {
      return y(d.value) - 10;
   })
}
这里,在mouseover事件中,我们希望将条形宽度和高度以及所选条形的条形颜色增加为红色。 对于颜色,我们添加了一个“突出显示”类,它将所选条形的颜色更改为红色。
到条的转换函数持续200毫秒。 当我们将条的宽度增加5px,高度增加10px时,从条的前一个宽度和高度到新的宽度和高度的过渡将持续200毫秒。
接下来,我们向条形计算了一个新的“y”值,以便条形不会因新的高度值而扭曲。
Step 12 - Mouseout event handler function - 让我们创建一个mouseout事件处理程序来处理鼠标事件。 它定义如下。
function onMouseOut(d, i) {
   d3.select(this).attr('class', 'bar');
   d3.select(this)
      .transition()
      .duration(400).attr('width', x.bandwidth())
      .attr("y", function(d) { return y(d.population); })
      .attr("height", function(d) { return height - y(d.population); });
   d3.selectAll('.val')
      .remove()
}
这里,在mouseout事件中,我们想要删除我们在mouseover事件中应用的选择功能。 因此,我们将bar类还原为原始的“bar”类,并恢复所选条形的原始宽度和高度,并将y值恢复为原始值。
d3.selectAll('.val').remove()函数用于删除在条形选择期间添加的文本值。
Step 13 - Working Example - 完整程序在以下代码块中给出。 创建一个网页animated_bar.html并向其添加以下更改。
<!DOCTYPE html>
<html>
   <head>
      <style>
         .bar {
            fill: green;
         }
         .highlight {
            fill: red;
         }
         .title {
            fill: blue;
            font-weight: bold;
         }
      </style>
      <script src = "https://d3js.org/d3.v4.min.js"></script>
      <title> Animated bar chart </title>
   </head>
   <body>
      <svg width = "500" height = "500"></svg>
      <script>
         var svg = d3.select("svg"),
         margin = 200, width = svg.attr("width") - margin,
         height = svg.attr("height") - margin;
         svg.append("text")
            .attr("transform", "translate(100,0)")
            .attr("x", 50).attr("y", 50)
            .attr("font-size", "20px")
            .attr("class", "title")
            .text("Population bar chart")
         var x = d3.scaleBand().range([0, width]).padding(0.4),
         y = d3.scaleLinear().range([height, 0]);
         var g = svg.append("g")
            .attr("transform", "translate(" + 100 + "," + 100 + ")");
         d3.csv("data.csv", function(error, data) {
            if (error) {
               throw error;
            }
            x.domain(data.map(function(d) { return d.year; }));
            y.domain([0, d3.max(data, function(d) { return d.population; })]);
            g.append("g")
               .attr("transform", "translate(0," + height + ")")
               .call(d3.axisBottom(x))
               .append("text")
               .attr("y", height - 250)
               .attr("x", width - 100)
               .attr("text-anchor", "end")
               .attr("font-size", "18px")
               .attr("stroke", "blue").text("year");
            g.append("g")
               .append("text")
               .attr("transform", "rotate(-90)")
               .attr("y", 6)
               .attr("dy", "-5.1em")
               .attr("text-anchor", "end")
               .attr("font-size", "18px")
               .attr("stroke", "blue")
               .text("population");
            g.append("g")
               .attr("transform", "translate(0, 0)")
               .call(d3.axisLeft(y))
            g.selectAll(".bar")
               .data(data)
               .enter()
               .append("rect")
               .attr("class", "bar")
               .on("mouseover", onMouseOver)
               .on("mouseout", onMouseOut)
               .attr("x", function(d) { return x(d.year); })
               .attr("y", function(d) { return y(d.population); })
               .attr("width", x.bandwidth()).transition()
               .ease(d3.easeLinear).duration(200)
               .delay(function (d, i) {
                  return i * 25;
               })
            .attr("height", function(d) { return height - y(d.population); });
         });
         function onMouseOver(d, i) {
            d3.select(this)
            .attr('class', 'highlight');
            d3.select(this)
               .transition()
               .duration(200)
               .attr('width', x.bandwidth() + 5)
               .attr("y", function(d) { return y(d.population) - 10; })
               .attr("height", function(d) { return height - y(d.population) + 10; });
            g.append("text")
               .attr('class', 'val')
               .attr('x', function() {
                  return x(d.year);
               })
            .attr('y', function() {
               return y(d.value) - 10;
            })
         }
         function onMouseOut(d, i) {
            d3.select(this)
               .attr('class', 'bar');
            d3.select(this)
               .transition()
               .duration(200)
               .attr('width', x.bandwidth())
               .attr("y", function(d) { return y(d.population); })
               .attr("height", function(d) { return height - y(d.population); });
            d3.selectAll('.val')
               .remove()
         }
      </script>
   </body>
</html>
现在,请求浏览器,我们将看到以下响应。
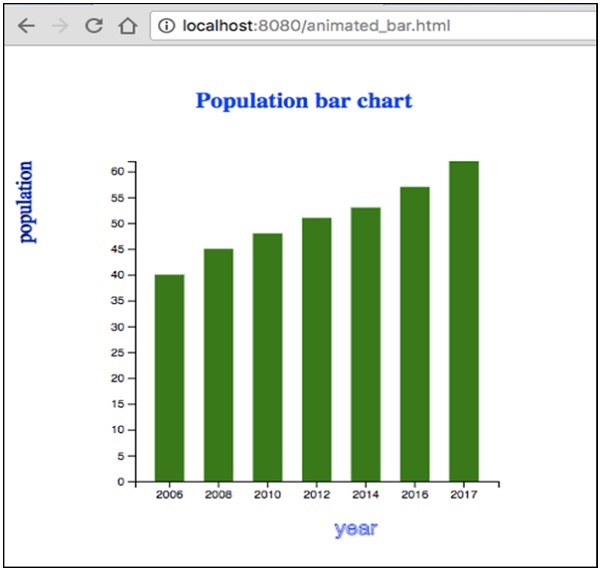
如果我们选择任何条形图,它将以红色突出显示。 D3是一个通用的可视化库,用于处理数据到信息,文档,元素等的转换,最终有助于创建数据可视化。
